Instructions for the placement of camera traps and calculation of density of medium to big sized mammals
June 2022This document presents instructions to estimate the density of medium to big sized mammals through the use of camera traps (CTs). Since different methods are available, we will focus on a practical one that is capable of generating reliable data in a wide range of situations (and species) throughout Europe. The random encounter (REM) model does not require individual recognition. However, it is necessary to collect certain information to determine the speed of movement (average daily movement range) of the animals.
During 2022 the European Observatory of Wildlife (EOW) will implement the use of artificial intelligence to already available online tools (Agouti) to automatically process and analize images. Since 2022 is a transitional year, from manual processing (e. g.; see link) to automatic image processing, EOW members need to apply sections 1 (general) , 2 (for automatic image processing) and 3 ( in the field).
1. General
- The work should be developed during summer/early autumn, with the CTs placed for a minimum of 60 days.
- They will be placed (registering the geographical coordinates) following a regular uniform distribution as a grid with a minimum of 36 CT placements.
- The separation between CTs will be approx. 1.5 km.
- The exact location can be within a diameter of fewer than 100 m around the points of the grid. If the number of CTs available is not enough to sample the 36 placements at the same time, the CTs should be moved during the experiment to cover a minimum of 36 locations. For instance 12 CTs moved twice (every 3 weeks), which fits a study area of approximately 2500-3000 has. In case the number of CTs is 15, the final sampling will be 45 CT placements.
- However in case the study area is bigger, the distances between camera traps can be larger that 1.5 km, and if possible, it is recommended placing more camera sites.
- The grid must cover at least one patch beaten for hunting big game during the hunting season, if possible more; or several grids for several patches. This is not compulsory (there are study sites of the EOW where hunting is not practiced)
- The CT will be placed on poles or vegetation 50 cm above the ground.
- The CT is configured with the operation of 24 hours per day and to take up to three consecutive images (the maximum number possible), with the minimum waiting time (0 sec. if possible) between activations. Use medium sensitivity. If the time lapse between consecutive photos of the same burst is high (>2-3 sec.), video mode is recommended.
- The flash intensity should be set at medium (if possible) to avoid “overexposed photos”.
Check that the date and time are correctly set, and that they are printed automatically on each image. - The CT should be reviewed at least in half of the study period (ideally once a month) to check its functioning and placement. Normally it will not be necessary to change the batteries and the memory cards, since the CTs are placed at random points and high wildlife activity is not expected.
- Choose a field of vision of the CT that is cleared of vegetation (it is not necessary to be totally clean, but that allows the detection of any animal that passes within the first 5 m), being better a north orientation.
- A form (see below)must be filled in, collecting the information of each CT during its placement (see below). All the information that is subsequently extracted must keep the traceability of the CT (mark the source camera of each memory card extracted, and keep this nomenclature in the folders that are created on the computer to archive the images). Shortly, ENETWILD will provide an app based on Smart which will be useful to collect this information in the field.
2. Camera trap calibration for measuring animal positions using AGOUTI tool
After setting up the CT firmly, and in a position ready to capture wildlife images, hold the pole with is based on the ground and held perpendicular to the camera’s line of sight.
- Hold the pole still long enough to ensure a clear image (5-10 seconds). In order to indicate when the pole is resting on the ground, give a distinctive hand gesture when this is the case. For example, thumbs up
- Repeat it 20-25 times covering homogeneously all the field of view of the camera. From very close to at least as far as the furthest distance you expect to record animals (Fig. 1).
- Every CT deployment needs its own calibration. If you change the batteries and/or card, which indeed typically changes the camera view in most circumstances, you effectively start a new deployment on the same location.Therefore, the calibration should be repeated when removing the camera, as well as when setting and checking it.
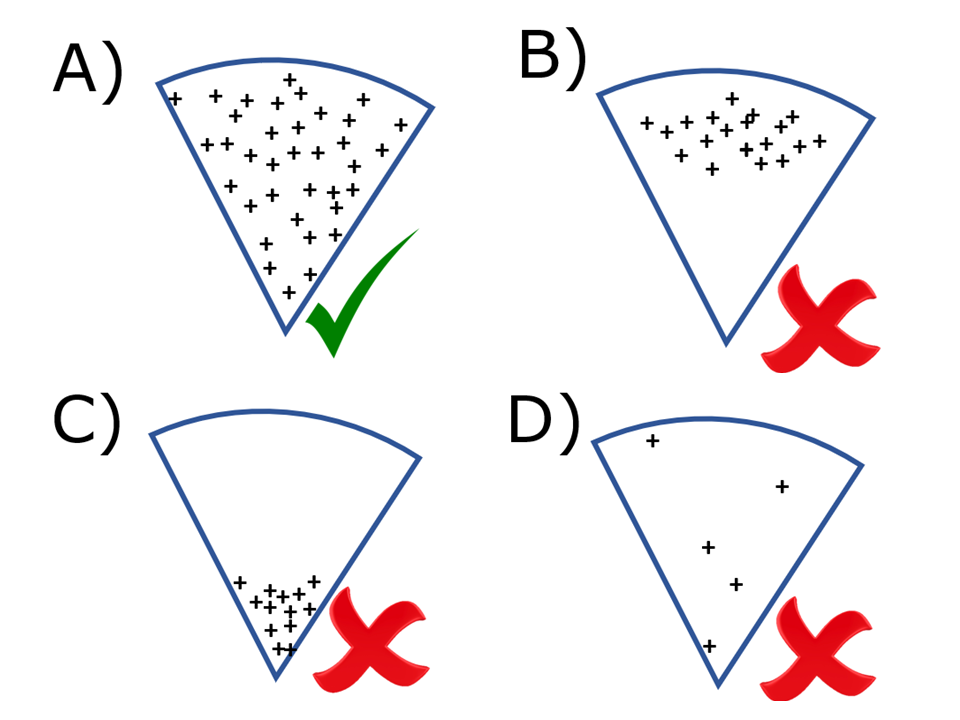
Figure 1. Example of four schemes of calibration of a single camera trap. Crosses represent all the locations of the calibration pole. Panel A represents an adequate calibration (more than 20 points covering homogeneosly all the detection zone). Panels B, C and D represent wrong calibrations; in panels B and C the points are not homogeneously distributed; in panel D, few points were recorded.
3. Preparation of the CT field of detection for manual measuring of animal positions
Place stakes in 2.5 m intervals (Fig. 2 A). Connecting the stakes with signalling tape helps to better visualize distances (Fig. 2 C). Finally, ensure that a photograph is taken from the CT where these stakes are evident. Take also one picture with your mobile device from standing position. These two pictures will later help to position animals observed in the pictures. Put natural marks (e.g.; stones,) before remove the stakes for later identification of the path of the animals photographed (Fig. 2 D).
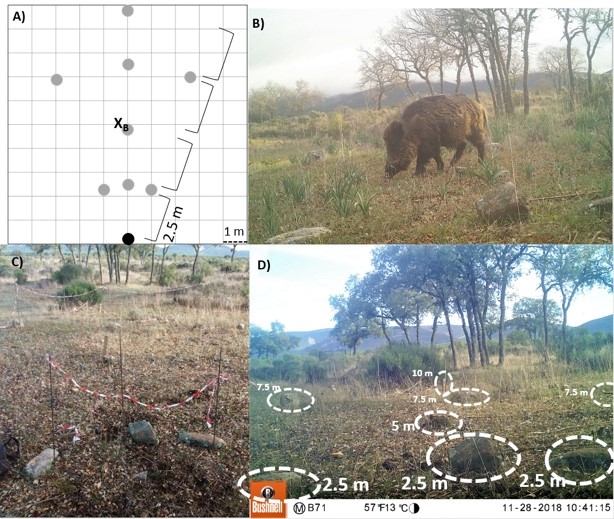
Figure 2. A) Scheme of the stick-structure (grey dots) used to reference the animal captured by the camera-trap (black dot). XB indicates the position of the wild boar captured in the image B. B) Wild boar photo-captured. C) Photo of the structure installed in one photo-trapping sampling point. The camera should be oriented so that the well-centred stakes are displayed. D) Natural marks (stones) used as references after removing stakes.
Required material
- CT adequately configured (see above), with proven batteries (alkaline) and compatible memory card. Check that the cards save the photos well, since sometimes they are not compatible with the camera model
- Memory card of 8 GB minimum size, recommended 16 GB if the camera supports it
- Calibration pole (see video)
- 50 cm stakes (or poles) and hammer to place them. 8 of them are required for the initial photograph of each study point, 2 of them will stay (5 & 10 m)
- Signalling tape
- GPS for recording geographical coordinates
- Single-use camps are very practical for fixing the cameras
- Hoe for vegetation cleaning, only the strictly necessary within the first 5 meters
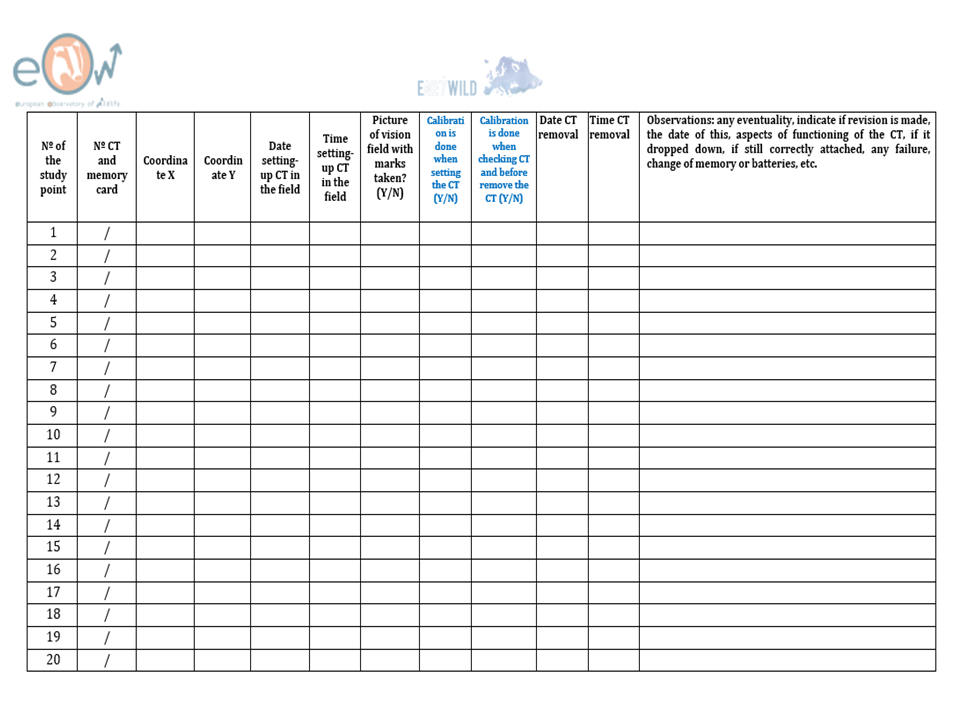
Figure 3 Example of a sampling data collection sheet